This guide explains how MuscleMap calculates your tension score from raw force and displacement data, and what that score actually means. Stiffness values vary widely across muscle sites, and even between men and women. A November 2025 pilot study in the Journal of Manual and Manipulative Therapy established preliminary reference ranges for muscle stiffness and asymmetry and found males showed significantly higher stiffness, with a coefficient of 44.6 N/m, over females. A 2026 pilot study in Scientific Reports developed a standardized 38-point myotonometric protocol for the lower limbs and recorded stiffness values ranging from 137 to 1,118 N/m across measurement points. That range shows why muscle-specific reference values matter, and why MuscleMap calibrates each region separately, tracking each patient against their own baseline rather than a single population-wide number.
A new finding to flag: a 2025 reliability study in the journal Cranio reported that handheld myotonometry produces reliable stiffness readings across raters and across sessions for cervico-mandibular muscles. Stiffness is one of the parameters where reliability holds up best, which is why we built the device's primary output around it.
And from 2025: a Scientific Reports validation study compared MyotonPRO, Shore Durometer, IndentoPRO, and the Tissue Compliance Meter against shear wave elastography on layered phantom tissues. ICCs ranged from 0.88 to 0.99 across devices, with strong concurrent validity against SWE. That is direct evidence that handheld stiffness measurement (the method MuscleMap uses) tracks the gold-standard imaging reading within an actionable margin for clinical use.
What We're Measuring
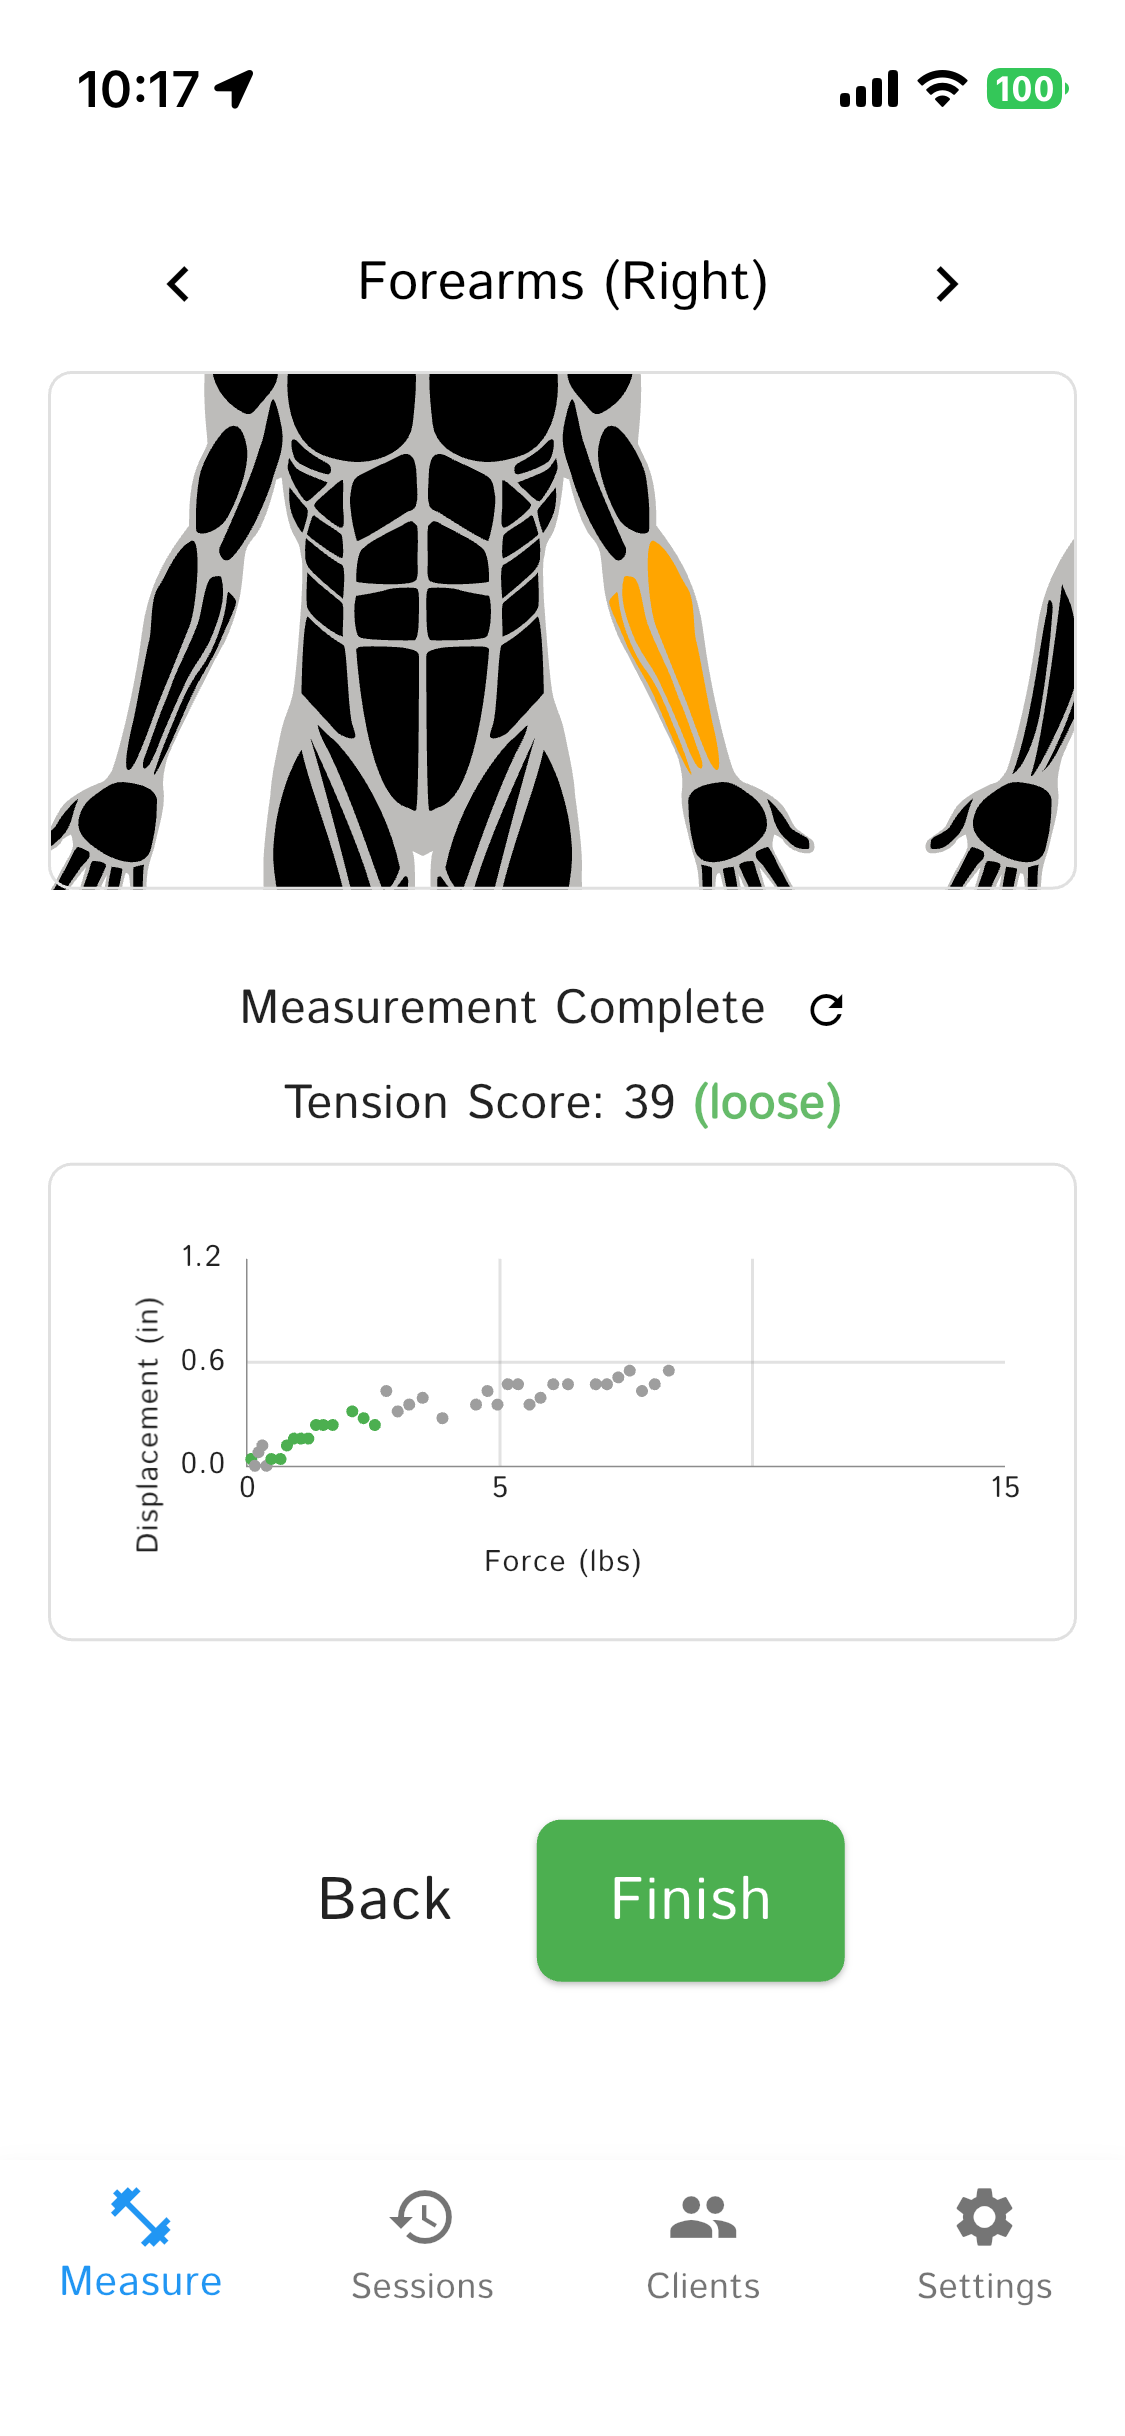
When you press the MuscleMapper into a muscle, it records a series of force and displacement data points as you press into the tissue. The force is not fixed — the device captures many data points across a range of pressures, building up a detailed picture of how the tissue responds.
- Force: How much pressure you're applying (displayed in lbs in the app; captured internally in Newtons)
- Displacement: How far the tissue compresses in response (displayed in inches in the app; captured internally in millimeters)
The relationship between force and displacement tells us about soft tissue compliance — how the tissue responds to pressure. This correlates with resting muscle tone, guarding patterns, and overall tissue stiffness. Think of it like measuring how springy or resistant the muscle belly is.
The Evidence
When a clinician asks whether this device is backed by research, here's the honest walk-through.
What myotonometry is
Myotonometry is a quantitative, noninvasive method for measuring the mechanical properties of soft tissue. Instead of palpating and describing what you feel ("tight," "guarded"), you apply a controlled mechanical input to the tissue and get a number back that describes how stiff it is. The field's main narrative review defines it using the force-displacement equation: the ratio of applied force to tissue deformation.
Handheld myotonometers using this method have been in the peer-reviewed record since the late 1990s.
Why MuscleMapper is myotonometry
MuscleMapper presses into tissue with a known force, measures how much the tissue deforms, and derives stiffness from the ratio. That's the classic force-displacement implementation of myotonometry, and it's the older of the two main approaches in the literature.
- Force-displacement (what MuscleMapper uses): Press, measure deformation, compute ratio. The Neurogenic Technologies "Myotonometer" is the oldest published example of this implementation.
- Impulse-oscillation (what MyotonPRO uses): Brief mechanical tap, accelerometer records the damped oscillation that comes back, stiffness derived from the waveform. Different mechanism, same method category, same clinical output.
When you see MyotonPRO research, it applies to the broader method. MuscleMapper produces a number in the same units from the same physical property, using the older and simpler hardware approach.
Hardware precision
Two sensors, one output:
- Force: 5kg single-point strain-gauge load cell paired with a 24-bit ADC (the HX711). Combined error on this class of load cell runs ±0.02% to ±0.05% of full-scale, which works out to roughly ±1 to ±2.5 grams at 5kg.
- Displacement: VL6180 time-of-flight laser sensor at 1mm resolution.
Both physical inputs are measured at resolutions finer than the clinical signal you're acting on.
Three studies worth reading
MyotonPRO has the deepest published record for myotonometry and is the closest reference point. These three studies establish what the method can and can't do.
1. Stiffness can track pain laterality.
Wu et al. measured paravertebral muscles with MyotonPRO in 60 elderly patients with unilateral chronic low back pain. Stiffness on the painful side was significantly higher than on the non-painful side across all lumbar levels, and the degree of asymmetry correlated with pain severity (VAS) and disability (ODI). Why it matters: when a patient walks in pointing to one side, there's often an objective asymmetry to show them. (PMC8866935)
2. Stiffness is elevated in chronic pain, but it's not the same signal as pain.
Lederer et al. studied 40 chronic neck and back pain patients with MyotonPRO. Tissue stiffness was elevated overall, but only about half the patients had their stiffest side match their more painful side. Cupping reduced stiffness temporarily while pain relief followed a different timeline. Why it matters: stiffness and pain are related but independent. That's precisely why it is useful as a second data point. When they converge you have strong signal. When they diverge, you have something worth talking about. (PMC6942862)
3. Stiffness reflects treatment response over a course of care.
McGowen et al. (J Athletic Training 2023) reviewed how myotonometry has been used to track tissue response to dry needling, manual therapy, and thoracic mobilization across gastrocnemius, erector spinae, quads, and hamstrings. Why it matters: the method is responsive enough to capture change across an episode of care, which is the timeframe a DC actually treats on. (PMC11215642)
Reliability
A 2024 systematic review synthesized 48 studies on myotonometric reliability. Intraclass correlation coefficients for stiffness typically fall in the 0.75 to 0.91 range across muscles and raters (conventional interpretation: 0.75 to 0.90 is "good," above 0.90 is "excellent"). Reliability varies by muscle, positioning, rater training, and device implementation. (PMC11205912)
Honest limits
To be upfront about what this evidence does and doesn't cover:
- Wu and Lederer used MyotonPRO specifically (the impulse-oscillation implementation). The McGowen review covers myotonometry more broadly, including force-displacement devices like the Neurogenic Technologies Myotonometer, which is the closest methodological match to MuscleMapper.
- MuscleMapper as a specific device has not been independently published yet. The honest framing: a well-established method with published evidence for both implementations, with newer hardware on our end.
- A stiffness number is one objective data point. It doesn't diagnose, doesn't predict recurrence, and doesn't isolate a single physiological cause. It's a signal for clinical conversation, not a verdict.
How Much Pressure Should You Apply?
You need to press until you hit the wall (bone or the fascia layer above it). If you stop too early, you won't capture the full muscle response. But once you've reached the wall, it doesn't matter if you keep pushing. Thanks to our wall detection algorithm, pressing past the wall won't affect your score.
The protocol is simple:
- Place the MuscleMapper perpendicular to the muscle
- Press steadily into the tissue at a comfortable pace
- Keep pressing until you feel resistance (bone or the fascia layer above it)
- Release and check your score
The algorithm automatically detects when you've hit the "wall" (bone or the fascia layer above it) and excludes that data. So once you've reached the wall, it doesn't matter if you keep pushing. Your tension score will be the same because only the soft muscle tissue response counts.
Tips for best results:
- Press at a steady, moderate pace (not too fast, not too slow)
- Keep the device perpendicular to the muscle surface
- Don't worry about pressing "too hard" - the algorithm handles it
- Aim for at least 3-5 seconds of pressing to capture enough data points
The Basic Idea
We model muscle tissue using a straightforward relationship between force and displacement:
Where:
- Slope: Muscle compliance (higher numbers mean softer muscle)
- Intercept: Starting point when no force is applied
How We Process Your Data
Step 1: Clean Up the Data
Raw sensor data isn't perfect, so we automatically filter it through multiple stages to get the best results:
- Basic filtering: Remove readings that are too low to be meaningful
- Force derivative check: Filter out sudden force spikes that indicate measurement errors
- Smoothing: Apply moving averages to reduce sensor noise
- Artifact removal: Eliminate unrealistic distance jumps and initial contact errors
- Statistical outliers: Remove data points that fall outside expected ranges
- Wall detection: When pressing deep into muscle tissue, you may hit bone or the fascia layer above it. This "wall" contact shouldn't affect your tension score. The algorithm detects this using a sliding window approach: it calculates the local slope across windows of 8 data points, tracks where the slope peaks (softest tissue), and watches for a sustained drop. When 2 consecutive windows fall below 25% of the peak slope, the algorithm confirms you've hit the wall and automatically excludes that data.
Why wall detection matters: Measurements with light pressure and heavy pressure (pressing into the wall) should produce similar tension scores. Only the soft muscle tissue response counts toward your score - so whether you press lightly or push hard into the wall, your results stay consistent.
We need at least 3 good data points to calculate a score. If there aren't enough, you'll see "??" instead.
Step 2: Find the Best Line
Using the clean data, we find the best-fit line through your force-displacement points. Think of it like drawing a line through scattered dots on a graph. For measurements with enough data points, we use an advanced technique called robust regression that automatically finds and excludes remaining outliers to make the line even more accurate.
Step 3: Check Against Muscle Norms
Different muscles have different normal characteristics. Your calf muscle, for example, behaves very differently from your bicep. We compare your measurement to what's typical for that specific muscle to make sure the reading makes sense.
Step 4: Assess Reliability
Not every measurement is equally reliable. We check whether your slope calculation meets our quality standards and falls within expected ranges for that muscle. If the slope is too small or the ratio compared to expected values is too low, we won't calculate a score - you'll see "??" instead.
Calculating Your Score
The Slope Ratio
Your score is based on one key number: the slope ratio — how your muscle's measured slope compares to the expected slope for that muscle region.
A slope ratio of 1.0 means your muscle is exactly average. Higher than 1.0 means softer (more compliant), lower than 1.0 means stiffer (more tension).
Normalization
We normalize the slope ratio into a 0–100 scale using bounds of 0.3 (very stiff) to 2.3 (very soft). These bounds were calibrated from 753 production measurements. The formula:
Finally, we invert the result so that higher scores mean tighter muscles (more intuitive for a "tension score"):
What Your Score Means
The colors follow a directional model — each color tells you both how far and in which direction a muscle deviates from its expected range. Green means normal, warm colors (orange/red) mean tighter than expected, and cool colors (blue) mean more underactive than expected.
- 80–100 = Very Tight (Red) - Much stiffer than normal
- 60–79 = Tight (Orange) - Stiffer than typical
- 40–59 = Normal (Green) - Right where we'd expect for this muscle
- 20–39 = Underactive (Light Blue) - Softer than typical
- 0–19 = Very Underactive (Dark Blue) - Much softer than normal
A Real Example
Let's say you measured your left calf and got these results:
Your Measurement:
- 12 good data points after filtering
- Calculated slope: 0.342 mm/N
- Expected slope for calf: 0.240 mm/N
The Calculation:
- Slope ratio: 0.342 ÷ 0.240 = 1.43 (about 43% more compliant than average)
- Normalized: ((1.43 − 0.3) ÷ (2.3 − 0.3)) × 100 = 56.5
- Inverted: 100 − 56.5 = 44
Bottom Line:
A score of 44 puts you in the Normal (Green) category — your calf muscle is right where we'd expect it to be.
Things to Keep in Mind
- Every muscle is different: What's normal for your quads might be tight for your forearms
- Track your own progress: Focus on how your scores change over time rather than comparing to others
- Technique matters: Consistent pressure and positioning give you the most reliable results
- Small differences are normal: Don't worry about tiny variations between measurements
Why This Approach Works
This method gives you reliable results because it:
- Uses proven science: Built on established biomechanical principles
- Filters intelligently: Multiple filtering stages catch different types of measurement errors
- Simple and transparent: One input (slope ratio), one output (tension score) — easy to understand and verify
- Muscle-specific benchmarks: Each muscle has its own expected slope, calibrated from real measurements
- Provides actionable insights: Gives you information you can actually use in your practice
- Stays consistent: Uses the same approach across all muscle groups
Note: We've calibrated the normalization bounds from 753 production measurements across 150+ sessions to ensure scores spread meaningfully across the 0–100 range.
Why do different muscle sites produce such different stiffness numbers?
Stiffness depends on the muscle's anatomy, depth, fiber composition, and resting tone. A 2026 multi-point mapping study recorded values from 137 N/m at soft compartments to over 1,100 N/m near tendons in the lower limbs. That is why MuscleMap uses muscle-specific reference slopes rather than a single threshold for the whole body.
How does handheld stiffness measurement compare to shear wave elastography (SWE)?
A 2025 Scientific Reports validation study tested four handheld devices (MyotonPRO, Shore Durometer, IndentoPRO, and Tissue Compliance Meter) against SWE on layered phantom tissues mimicking healthy and diabetic plantar soft tissues. Intraclass correlation coefficients ranged from 0.88 to 0.99, with strong concurrent validity to SWE. Handheld measurement is not the gold standard, but it tracks the gold-standard reading well enough for clinical decision-making, at a small fraction of the cost.
Do stiffness reference ranges differ between men and women?
Early evidence suggests yes. A November 2025 pilot study in the Journal of Manual and Manipulative Therapy established preliminary reference ranges for muscle stiffness and bilateral asymmetry using myotonometry and found males showed significantly higher stiffness than females, with a coefficient of 44.6 N/m. This is one reason MuscleMap tracks each patient against their own baseline rather than a single population-wide number.
What does MuscleMap's tension score measure?
The tension score measures soft tissue stiffness using force-displacement myotonometry. The MuscleMapper presses into the tissue with a known force and records how much the tissue deforms. The ratio of force to displacement gives a stiffness value, which is normalized to a 0-100 scale where higher scores indicate stiffer tissue.
Is MuscleMap's measurement method backed by research?
Yes. MuscleMap uses force-displacement myotonometry, a method with a peer-reviewed record since the late 1990s. A 2024 systematic review of 48 studies found intraclass correlation coefficients of 0.75-0.91 for myotonometric stiffness measurements, indicating good to excellent reliability. MuscleMap as a specific device has not been independently published, but the underlying method is well-established.
What does a tension score of 50 mean?
A score of 40-59 falls in the Normal (Green) range, meaning the muscle's stiffness is close to the expected value for that muscle region. Scores above 60 indicate stiffer than typical tissue (orange or red), and scores below 40 indicate softer than typical tissue (blue).
Questions?
Want to know more about the technical details or have questions about your specific measurements? Feel free to reach out at harrisonshu@getmusclemap.com.